Satellite and Drone Crop Health Monitor
A crop monitoring platform that combines satellite passes with drone surveys, scores the health of every field zone with deep learning, and alerts agronomists where to look first.
Project overview
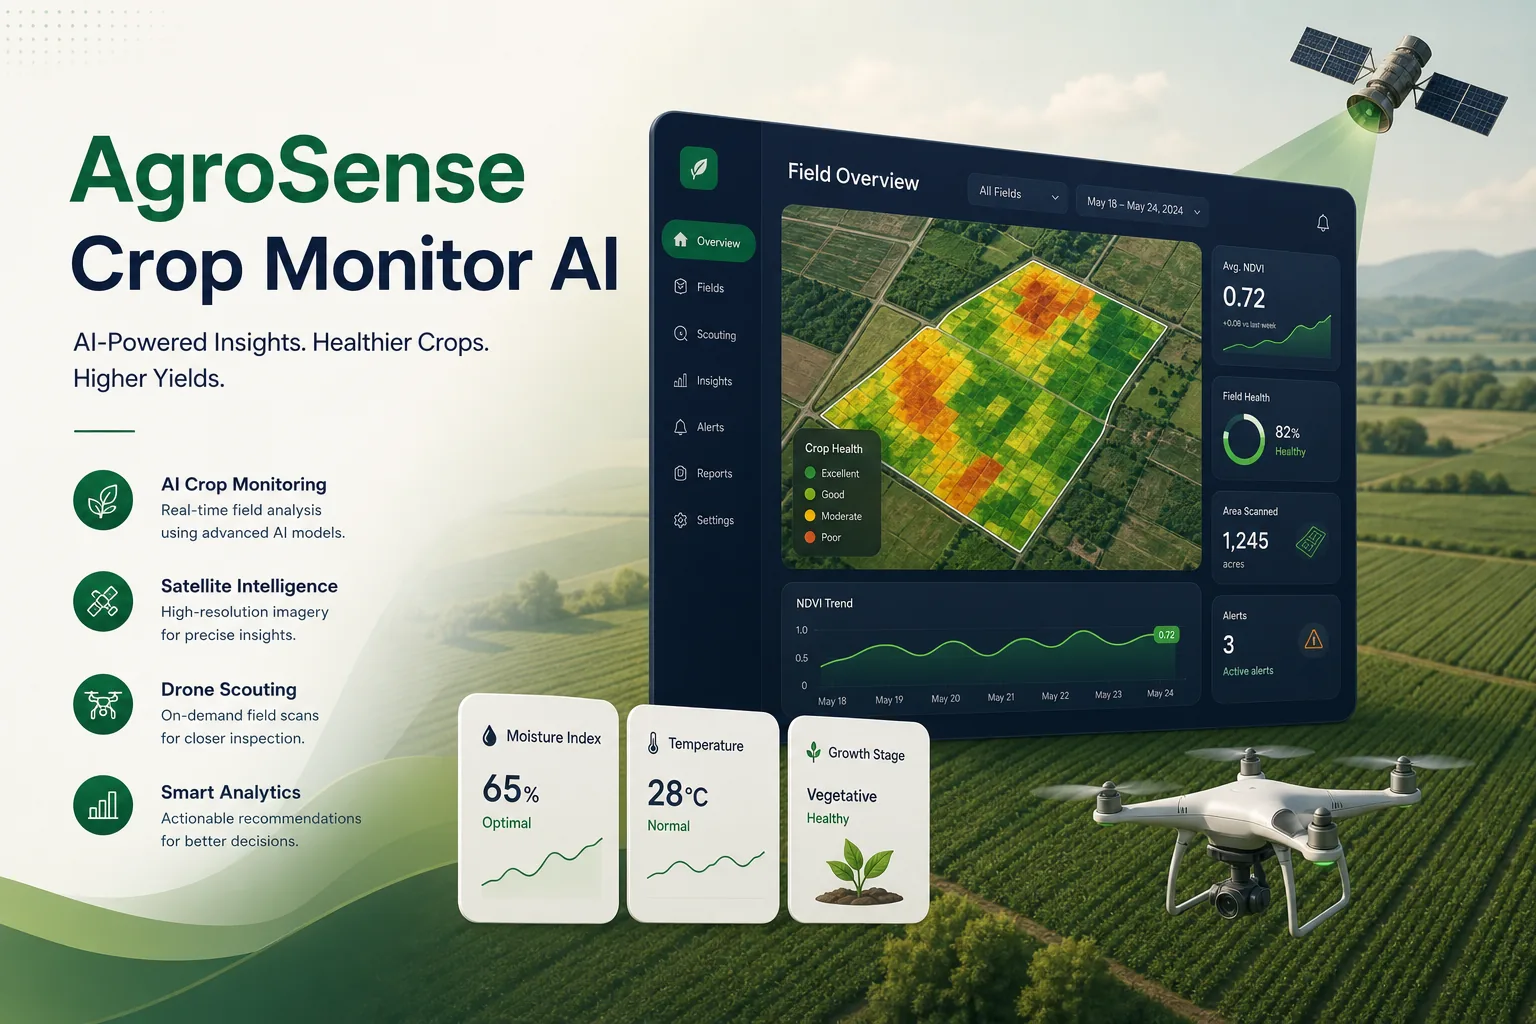
We built a crop health monitoring platform for an agricultural advisory company whose agronomists look after a large number of farms. The system pulls regular satellite imagery for every registered field, adds higher-resolution drone surveys where they exist, and produces a health score for zones within each field so agronomists can prioritise visits.
Our scope covered discovery with the agronomy team, data pipeline design, model training, the map dashboard and a lightweight mobile view for field scouting. It is part of our machine learning development work, where remote sensing data has to be turned into decisions people in the field can act on.
The client and the challenge
Agronomists relied on walking fields and on farmers phoning in problems. By the time stress from water shortage, disease or nutrient deficiency was visible from the field edge, treatment options had narrowed. They had looked at free vegetation index maps, but these were hard to read, broken up by cloud and unrelated to the client's own field records.
The client wanted every field monitored automatically, clear zone-level scores rather than raw index layers, drone surveys folded in when a farm paid for them, and alerts that respected each crop's growth stage so a naturally changing canopy was not mistaken for a problem. Agronomists also needed to trust the output, so every score had to be traceable back to the imagery and history behind it.
Solution architecture & delivery
Field boundaries, crop type and sowing dates are stored for each farm. A scheduled Python job requests new multispectral scenes for those boundaries through Sentinel Hub, applies the cloud and shadow mask, and computes vegetation and moisture indices per pixel. Cloudy observations are marked as missing rather than averaged in, and the time series is smoothed so a single hazy pass does not trigger an alert.
Health scoring uses a PyTorch model that takes the recent index history for each zone together with crop type, days since sowing and local weather, and compares it with the expected curve for that crop at that stage. The output is a score and a likely stress type such as water, nutrient or possible disease. We trained it on historical imagery paired with the client's scouting notes and yield records, holding out whole seasons and regions for validation. Each score is stored with the scenes and index values that produced it, so an agronomist can always see why a zone was flagged.
When a drone survey is uploaded, the orthomosaic is aligned to the field boundary and a separate segmentation model, also in PyTorch, maps patches of weeds, lodging or bare soil at a much finer resolution. Those results override the satellite score for that date, so the dashboard always shows the most detailed evidence available.
Agronomists see fields coloured by score on a map, open a zone to view its index history and imagery, and log a scouting visit from their phone with photos and a confirmed diagnosis. Those confirmations feed back into the training set, and a monitoring job tracks score drift each season, similar to how we structure data in an AI-ready data architecture.
Key features we built
- Automatic satellite imagery retrieval for every registered field
- Cloud and shadow masking with gap-aware time series
- Zone-level crop health scores adjusted for growth stage
- Likely stress type: water, nutrient or possible disease
- Drone orthomosaic upload with weed and lodging segmentation
- Map dashboard with index history and imagery comparison
- Alerts ranked by severity and field area affected
- Mobile scouting log whose confirmed diagnoses retrain the model
How we delivered it
- Discovery. Field days with agronomists to learn how they diagnose stress, which crops mattered most and what records already existed.
- Data preparation. Assembling historical imagery for past seasons, aligning it with scouting notes and yield records, and agreeing labelling rules with the agronomy team.
- Model and pipeline build. Two-week sprints for the ingestion pipeline, scoring model, drone segmentation and dashboard, validated on held-out seasons.
- Season pilot. A full growing season on a subset of farms, comparing alerts with agronomists' own visits and tuning thresholds per crop.
- Roll-out and support. Onboarding of all farms, retraining after each season and pipeline maintenance under a support agreement.
Technology choices
- Python — runs the ingestion schedule, raster processing, index calculations, alert rules and the API behind the dashboard.
- PyTorch — trains and serves both the time-series health scoring model and the image segmentation model for drone surveys.
- Sentinel Hub — provides on-demand multispectral satellite scenes clipped to field boundaries, with cloud masks, so we did not have to download and store full tiles.
Outcomes
- Every registered field is checked automatically after each usable satellite pass
- Agronomists plan visits from a ranked list of stressed zones instead of routine rounds
- Drone surveys and satellite data appear in one timeline per field
- Scouting diagnoses are recorded digitally and improve the model each season
- Growth-stage-aware scoring cut down alerts caused by normal canopy changes
FAQ
How does the system handle cloudy satellite images?
Each scene is cloud and shadow masked, and obscured pixels are treated as missing data. The time series is smoothed across valid observations, and drone surveys fill gaps where a farm has them.
Can drone imagery and satellite imagery be used together?
Yes. Drone orthomosaics are aligned to the same field boundaries and analysed with a finer segmentation model. For that date the drone result takes precedence, and both remain visible in the field history.
What similar imagery projects have you delivered?
Our AI video analytics platform applies related computer vision techniques to camera feeds, and our computer vision development services cover image and video models more broadly.
How much does a crop monitoring platform like this cost?
It depends on the number of crops modelled, whether drone analysis is included and how much historical data needs preparing. Our app development cost calculator gives an indicative range for the dashboard and mobile scouting view, and we estimate the modelling work after discovery.
Satellite and Drone Crop Health Monitor screens
Build your next logistics & mobility product with Next Olive
Share your requirements — we will propose scope, timeline and stack within one business day.