
SKU-Level Retail Demand Forecasting
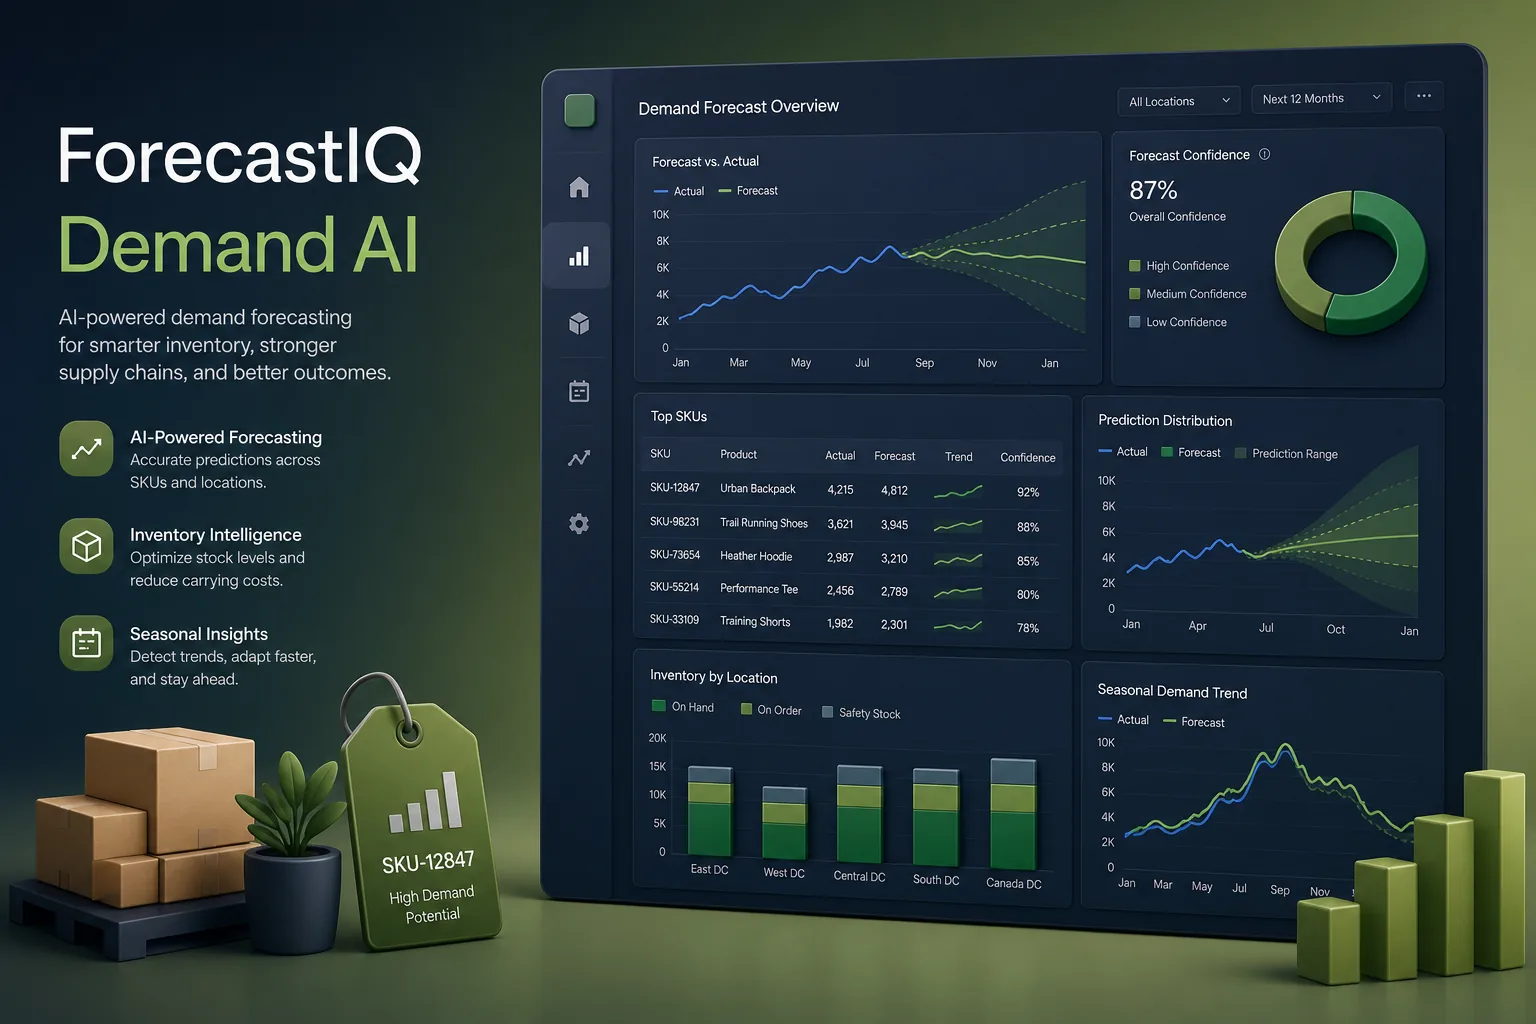
A machine learning forecasting system that predicts weekly demand for every product in every store, factoring in promotions, holidays and price changes, so planners order from one forecast.
Project overview
We built a demand forecasting system for a retail chain selling groceries and household goods through a network of stores. Every week it produces a forecast for each product in each store over the coming weeks, explains the main drivers behind it, and passes the numbers to the merchandising and replenishment teams.
The engagement covered data discovery, feature engineering, model development with Python, Prophet and XGBoost, a planner dashboard and integration with the client's ERP. It sits within our machine learning development services and our work for the e-commerce and retail industry.
The client and the challenge
Forecasting lived in spreadsheets maintained by category planners. Each used their own rules of thumb, promotions were adjusted by gut feel, and a store-level view was impossible because there were too many product and store combinations to handle by hand. Popular lines ran out during promotions while slow items piled up in back rooms. Head office had no consistent way to see which categories were forecast well and which were not.
The client wanted a single forecast at product and store level, a clear way to include planned promotions and price changes, sensible forecasts for new and intermittent products, and explanations planners could trust enough to act on. The system also had to fit around their existing ERP rather than replace it.
Solution architecture & delivery
Nightly extracts of sales, stock, prices, promotions and store attributes land in a data warehouse. Because out-of-stock days hide true demand, we flag them from stock records and treat those sales as censored rather than as genuine low demand. Store openings, closures and product substitutions are mapped so history carries across renamed or replaced items.
We used a two-layer approach. Prophet models the baseline at category and store level, capturing weekly and yearly seasonality and a holiday calendar that includes moving festivals. XGBoost then works at product and store level, taking the baseline as an input along with price, discount depth, promotion type, display placement, local events and lagged sales. This combination handles a very large number of series cheaply while still reacting to promotions that a pure time-series model misses.
New products borrow history from similar items chosen by category, price band and attributes, and intermittent sellers use a separate model that predicts both the chance of a sale and its size. Every forecast is produced as a range, not a single number, so replenishment can set cover according to risk. Forecast accuracy is measured every week per category against actual sales, and a drift monitor alerts us when a category's error moves outside its normal band, which usually points to a data feed problem or a change in shopper behaviour that needs retraining.
Planners open a dashboard showing forecast against actuals, the main drivers for any product and store, and upcoming promotions. They can override a forecast with a reason code, and overrides are tracked so we can see when human adjustments help or hurt. Approved forecasts are written back to the ERP through its import interface, following patterns we cover in AI in ERP.
Key features we built
- Weekly forecasts for every product and store combination
- Promotion, price and holiday effects modelled explicitly
- Out-of-stock detection so lost sales do not distort history
- Forecast ranges rather than single-point predictions
- Like-item history for new product launches
- Driver explanations for each forecast in the planner dashboard
- Planner overrides with reason codes and override tracking
- Automated write-back of approved forecasts to the ERP
How we delivered it
- Data discovery. Audit of sales, stock, promotion and pricing history to find gaps, out-of-stock periods and product code changes that needed cleaning.
- Backtesting. Rolling backtests over past seasons comparing the planners' spreadsheet forecasts, Prophet alone and the combined model, category by category.
- Build. Two-week sprints for the pipeline, models, dashboard and ERP integration, with planners reviewing forecasts for their own categories each sprint.
- Parallel run. Forecasts produced alongside the existing process for several cycles so planners could compare results before switching over.
- Roll-out and support. Category-by-category adoption, scheduled retraining and drift monitoring under a support agreement.
Technology choices
- Python — the language for data preparation, feature engineering, backtesting, orchestration of nightly runs and the dashboard API.
- Prophet — robust baseline forecasts with weekly and yearly seasonality and custom holiday calendars, easy for analysts to inspect and tune.
- XGBoost — learns promotion, price and local effects at product and store level quickly across many series, with feature importance that supports planner explanations.
Outcomes
- Planners order from one shared forecast instead of individual spreadsheets
- Promotions are planned with an expected uplift per store rather than a blanket guess
- Out-of-stock periods no longer drag down future forecasts for popular lines
- New products launch with a forecast based on similar items
- Replenishment sets stock cover from forecast ranges that reflect uncertainty
- Overrides are recorded, showing where planner judgement adds value
FAQ
Why combine Prophet and XGBoost instead of using one model?
Prophet captures seasonality and holidays well and is easy to inspect, while XGBoost is better at learning promotion and price effects across many products. Using the baseline as an input to XGBoost gave us both strengths.
How are new products forecast without sales history?
They borrow history from similar items matched on category, price band and attributes. As real sales arrive, the forecast shifts toward the product's own data.
Is this related to inventory optimisation?
Yes. Forecasts like these feed reorder decisions; our inventory forecasting and reorder recommendation case study covers that next step.
How much does a retail demand forecasting system cost?
Cost depends on the number of stores and products, data quality and the integrations required. Our SaaS development cost calculator gives an indicative range for the platform side, and we scope the modelling after a data audit.
SKU-Level Retail Demand Forecasting screens
Build your next e-commerce & retail product with Next Olive
Share your requirements — we will propose scope, timeline and stack within one business day.